Authors
Francis Kilkenny, Jessica Irwin, Kimberly Rizkowsky, Jeff Ott, Bryce Richardson, Kas Dumroese, USFS RMRS
Holly Prendeville, Brad St. Clair, USFS PNWRS
Kathryn Prive, The Understory Initiative
Matt Orr, Ron Reuter, OSU
Rob Massatti, USGS
Steve Larson, Blair Waldron, ARS
Overview
The efficacy of seed transfer zones in predicting the climatic match of seed sources to restoration sites has not been tested in non-tree species. Seed zones for bluebunch (Pseudoroegneria spicata) wheatgrass demarcate areas with similar climate and populations with climate-associated genetic variation. To examine if populations are locally or regionally adapted requires comparing performance of local and non-local populations in a reciprocal manner. We are using a reciprocal transplant experiment to investigate the efficacy of bluebunch wheatgrass seed zones. Results from this experiment will determine if seed zones for bluebunch wheatgrass are delineated appropriately or if they need modification. We investigate the effectiveness of empirical seed zones for bluebunch wheatgrass by comparing establishment, survival, and reproduction of populations from local seed zones to non-local seed zones.
- Evaluate adaptation of bluebunch wheatgrass populations from local seed zones relative to non- local seed zones.
- Model adaptation as a function of source location and common garden climates.
- Characterize traits and climatic factors important for adaptation.
- Model effects of climate change on native populations and consequences of assisted migration for responding to climate change.
Preliminary results and discussion – Across 16 common garden sites survival was high (>80%) through the first growing season. One site was completely lost with the majority of plants dying a month after transplant due to an extreme weather event. This site was re-planted, but subsequently lost due to repeated vandalism. Of the 15 sites that remained through 2017, plant survival declined over time to 54% on average. Plants varied in survival, leaf morphology, reproductive phenology and reproduction among common garden sites and among seed sources. The average local population performed slightly better than the average non-local population, but this result was only significant in one case (Figure 2, Table 1). Across all measures local was best in 36.7% of cases, the same in 37% of cases, and local was not best in 26.3% of cases. Relative performance depended on how local was defined. Defining local populations by seed transfer zone predicted the presence local adaptation more consistently than predictions based on the “derived local” definition. In particular, across all measure for “local”, local was best in 40% of cases, the same in 31.1% of cases, and local was not best in 28.9% of cases. For “defined local” local was best in 33.3% of cases, the same in 42.3% of cases, and local was not best in 23.8% of cases. “Derived local” also showed significant variation between trait measurements. Taken together this indicates that the use of seed transfer zones in bluebunch wheatgrass seeding will increase the chance of establishment or be neutral in the majority of cases and only be detrimental in some cases (Figure 2, Table 1).
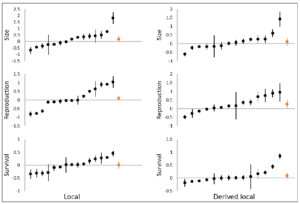
Figure 2. Evaluation of the performance of local populations relative to the average performance of all non-local populations for size, reproduction, and survival. Two definitions for local are used: 1) populations that are from the same seed transfer zone as the common garden are considered “local”; 2) populations that are from source environments within one standard deviation from the garden location in multidimensional climate space are considered “derived local”. Black circles represent the relative performance of the local population at a garden site, gray lines represent the average performance of non-local populations, and orange circles represent the average performance of local populations across all garden sites.
Table 1. Summery table for the analysis presented in Figure 1. Percentages show the proportion of gardens where the relative performance of local populations (see definition in Figure 1) was better, the same as, or worse than the average non-local population for size, reproduction, and survival. Green colors represent higher percentages and red colors represent lower percentages. The “Average Local Best?” column indicates whether the average relative performance of all local populations across the study is greater than the average performance of all non-local populations, and the “Average significant” column indicates whether this difference is significant.
|
Local Best |
Local Same |
Local Not Best |
Average Local Best? |
Average Significant? |
||
|
Local |
Size |
46.7% |
26.7% |
26.7% |
yes |
no |
|
Reproduction |
40.0% |
26.7% |
33.3% |
yes |
no |
|
|
Survival |
33.3% |
40.0% |
26.7% |
yes |
no |
|
|
Derived Local |
Size |
28.6% |
50.0% |
21.4% |
yes |
no |
|
Reproduction |
50.0% |
28.6% |
21.4% |
yes |
yes |
|
|
Survival |
21.4% |
50.0% |
28.6% |
no |
no |
Survival followed as similar pattern to size, with plants from cooler and wetter areas having higher survival than plants from warmer and dryer areas. This may also be related to life history adaptation to arid environments. Populations from warmer and dryer areas may exhibit a live-fast-die-young strategy where reproduction, rather than long term survival, has the highest contribution to fitness. Transfer distance functions can be used to build and modify seed transfer zones (Figure 3). They also provide managers with the tools to make decisions about how much movement is acceptable, and therefore dictate the size of seed transfer zones. The appropriate size of seed transfer zones is difficult to estimate from studies with few common gardens and is therefore subject to error. In this study, the Northern transect had 8 gardens with usable data, and the Southern transect had 7 gardens with usable data. This number appears to be sufficient to develop robust transfer distance functions. Research into other species will be helped by using common garden arrays of comparable size, since this will allow for robust estimates of transfer distance with a single study.
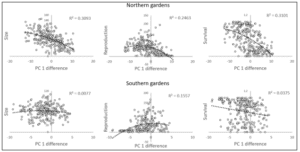
Figure 3. Transfer distance functions for Psuedoroegneria spicata Northern and Southern common garden transects for size, reproduction, and survival. PC 1 difference axis indicates expected trait values of a source population at a restoration site given the difference between the climate at the restoration site and the climate at the source location. Negative values on the PC 1 difference axis represent source locations that are cooler and wetter than garden sites, and positive values represent source locations that are warmer and wetter than garden sites.
Purpose
We are using a reciprocal transplant experiment to investigate the efficacy of bluebunch wheatgrass seed zones. Results from this experiment will determine if seed zones for bluebunch wheatgrass are delineated appropriately or if they need modification.
Geography
We established a reciprocal transplant study at 16 sites located in two broad regions (Figure 1)
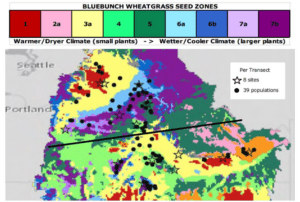
Figure 1. Map of bluebunch wheatgrass populations (black circles) used in eight common gardens (stars) in each transect (delineated) in the northwest US.